

Death Row in the United States: A Statistical Analysis [2025]
Updated: August 21, 2025
Death row in the United States has long been a subject of intense debate, reflecting the nation’s evolving perspectives on justice, morality, and human rights. As of 2024, the landscape of capital punishment continues to shift, influenced by legal battles, shifting public opinion, and the relentless work of advocacy groups. Through a comprehensive analysis, the Indianapolis criminal defense lawyers at The Criminal Defense Team of Baldwin, Perry & Wiley, P.C. aim to provide a nuanced understanding of the complexities surrounding this contentious issue in America.
Jump Links
- History of Death Row
- Does the Death Penalty Deter Crime?
- The Number of Executions Each Year
- The Number of Executions by State
- Top 5 States with Most Executions
- How Many People are Currently on Death Row?
- How Many Women are on Death Row?
- The Number of Executions by Ethnicity
- Wrongful Convictions of the Death Penalty
- Death Row Final Meals
- Methodology
- Death Row Executions of 2024

History of Death Row in the United States
The history of death row in the United States reflects the nation’s evolving legal standards and cultural attitudes. Capital punishment dates back to 1608, with practices influenced by English common law. In the 20th century, reforms emerged due to concerns over wrongful convictions and ethical issues, leading to the introduction of methods like the electric chair and gas chamber.
The landmark Supreme Court case Furman v. Georgia in 1972 temporarily halted executions, citing arbitrary application. In 1976, Gregg v. Georgia reinstated the death penalty under revised statutes. Subsequent decisions, such as Atkins v. Virginia (2002) and Roper v. Simmons (2005), further refined its application by prohibiting executions of intellectually disabled individuals and minors, respectively.
Does the Death Penalty Serve as a Deterrent for Crime?
Proponents of the death penalty hold that it serves as a deterrent to violent crime, provides justice and closure to victims’ families, and prevents recidivism. They also hold that some criminals are irredeemable and that the death penalty is the only way to ensure public safety.
However, several prominent organizations, including the National Association of Criminal Defense Lawyers (NACDL) and the American Civil Liberties Union (ACLU), strongly oppose the death penalty and advocate for its abolition through legislative reform. Their research indicates there is no evidence that capital punishment deters crime and that it is both inequitable and unjust. As of this writing, 23 states and the District of Columbia have abolished capital punishment.
The Number of Death Row Executions by Year
Since the reinstatement of the death penalty in 1976, there have been a total of 1,582 executions in the United States.
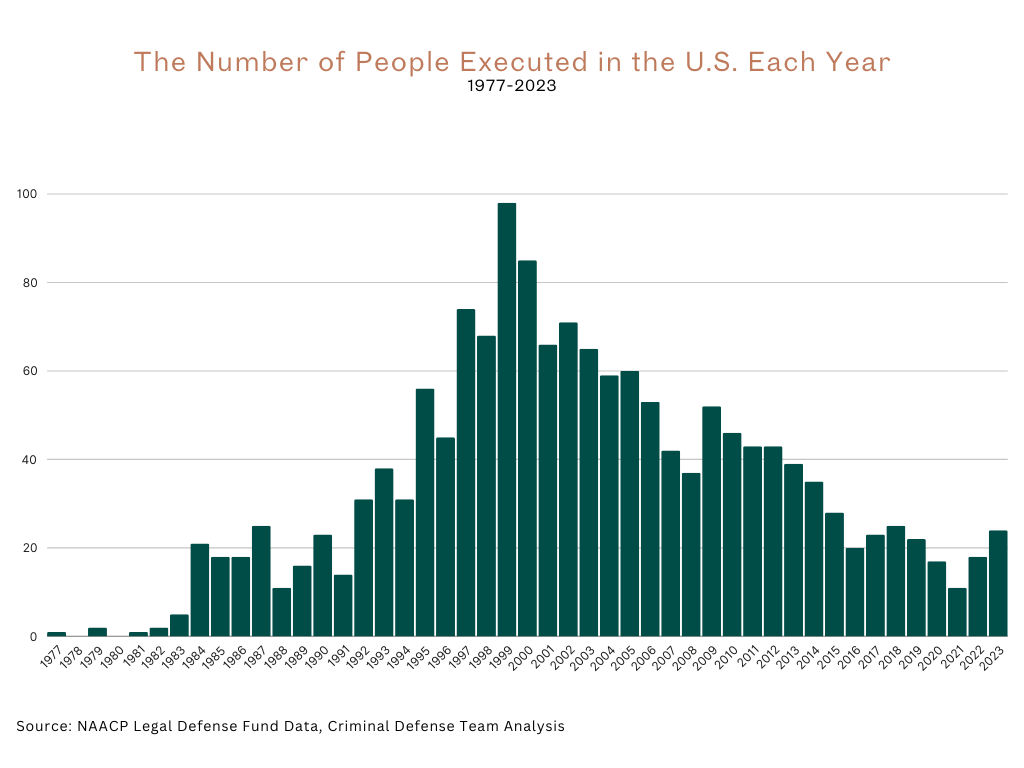
The number of executions in the United States has fluctuated significantly over the years, reflecting changing attitudes toward the death penalty and variations in legal practices. In the late 1970s and early 1980s, executions were relatively rare, with only a few carried out each year. However, from the mid-1980s to the early 2000s, there was a marked increase, peaking at 98 executions in 1999.
The trend began to decline in the 2000s, with the annual number of executions generally decreasing. For instance, the numbers fell from 85 in 2000 to 20 in 2016. More recently, the annual count has remained lower, with 24 executions in 2023. Overall, there have been 1,582 executions recorded, highlighting a complex evolution in the use of capital punishment over the past several decades.
The Number of Death Row Executions by State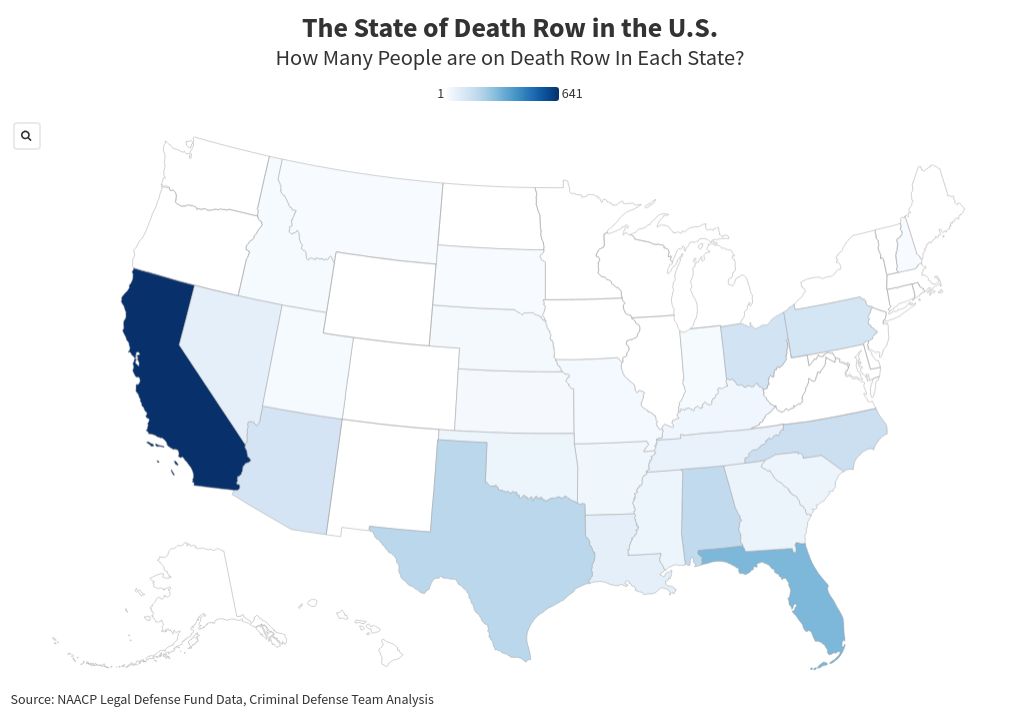
| State | Executions |
|---|---|
| Texas | 591 |
| Oklahoma | 127 |
| Virginia | 113 |
| Florida | 106 |
| Missouri | 101 |
| Alabama | 79 |
| Georgia | 77 |
| Ohio | 56 |
| South Carolina | 45 |
| North Carolina | 43 |
| Arizona | 40 |
| Arkansas | 31 |
| Louisiana | 28 |
| Mississippi | 23 |
| Indiana | 21 |
| Delaware | 16 |
| U.S. Gov | 16 |
| California | 13 |
| Tennessee | 13 |
| Illinois | 12 |
| Nevada | 12 |
| Utah | 8 |
| Maryland | 5 |
| South Dakota | 5 |
| Washington | 5 |
| Nebraska | 4 |
| Idaho | 3 |
| Kentucky | 3 |
| Montana | 3 |
| Pennsylvania | 3 |
| Oregon | 2 |
| Colorado | 1 |
| Connecticut | 1 |
| New Mexico | 1 |
| Wyoming | 1 |
| Alaska | 0 |
| District of Columbia | 0 |
| Hawaii | 0 |
| Iowa | 0 |
| Kansas | 0 |
| Maine | 0 |
| Massachusetts | 0 |
| Michigan | 0 |
| Minnesota | 0 |
| New Hampshire | 0 |
| New Jersey | 0 |
| New York | 0 |
| North Dakota | 0 |
| Rhode Island | 0 |
| Vermont | 0 |
| West Virginia | 0 |
| Wisconsin | 0 |
| Total | 1608 |
In contrast, many states have carried out very few or no executions at all; for example, 14 States, including Alaska, Hawaii, Iowa, Kansas, Maine, Massachusetts, Michigan, Minnesota, New York, North Dakota, and others have recorded zero executions. States like Colorado, Connecticut, and New Mexico each have only one execution. This variation underscores the patchwork nature of capital punishment in the United States, influenced by local laws, judicial practices, and shifting public opinions.
5 States with the Most Executions
The distribution of executions across U.S. states reveals significant regional differences in the application of the death penalty. Texas leads by a wide margin with 590 executions, followed by Oklahoma with 125 and Virginia with 113. Florida ranks fourth with 106 executions, while Missouri rounds out the top five with 100. These states have consistently enforced the death penalty more frequently than others, reflecting both legal frameworks and historical practices that support its use.
How Many Prisoners are Currently on Death Row?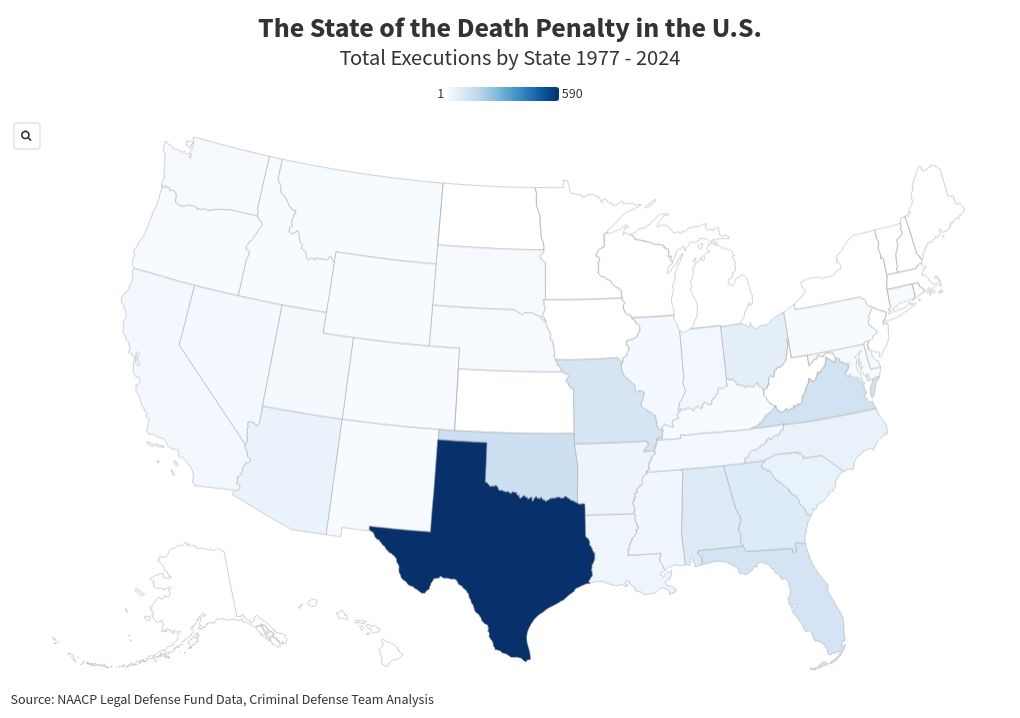
| State | Prisoners Currently in Death Row |
|---|---|
| California | 591 |
| Florida | 283 |
| Texas | 178 |
| North Carolina | 123 |
| Ohio | 116 |
| Arizona | 113 |
| Pennsylvania | 108 |
| Alabama | 81 |
| Louisiana | 63 |
| Nevada | 59 |
| Tennessee | 46 |
| Georgia | 37 |
| Mississippi | 37 |
| Oklahoma | 32 |
| South Carolina | 32 |
| Arkansas | 27 |
| Kentucky | 25 |
| Nebraska | 11 |
| Idaho | 9 |
| Kansas | 9 |
| Missouri | 8 |
| Indiana | 7 |
| Utah | 6 |
| U.S. Military | 4 |
| U.S. Gov | 3 |
| Montana | 2 |
| New Hampshire | 1 |
| South Dakota | 1 |
| Alaska | 0 |
| Colorado | 0 |
| Connecticut | 0 |
| Delaware | 0 |
| District of Columbia | 0 |
| Hawaii | 0 |
| Illinois | 0 |
| Iowa | 0 |
| Maine | 0 |
| Maryland | 0 |
| Massachusetts | 0 |
| Michigan | 0 |
| Minnesota | 0 |
| New Jersey | 0 |
| New Mexico | 0 |
| New York | 0 |
| North Dakota | 0 |
| Oregon | 0 |
| Rhode Island | 0 |
| Vermont | 0 |
| Virginia | 0 |
| Washington | 0 |
| West Virginia | 0 |
| Wisconsin | 0 |
| Wyoming | 0 |
| Total | 2013 |
As of August 21, 2025, there are 2,013 individuals on death row across the United States, reflecting a diverse geographic distribution and varying numbers by state. Despite California halting executions in 2006, they are currently the state with the highest number of death row inmates with 591 prisoners, followed by Florida with 283 and Texas with 178. In contrast, there are a total of 24 states and jurisdictions, including Alaska, Colorado, Connecticut, Delaware, and others, that have no death row inmates.
This variation highlights the uneven application of the death penalty across the country, influenced by state-specific policies, legal challenges, and shifts in public opinion. Additionally, the federal government and the military each have a small number of death row prisoners, with 3 and 4 respectively, with the federal government dropping 37 death row charges in the past year. The distribution of death row inmates underscores the complex and often fragmented nature of capital punishment in the United States.
How Many Women Were in Death Row?
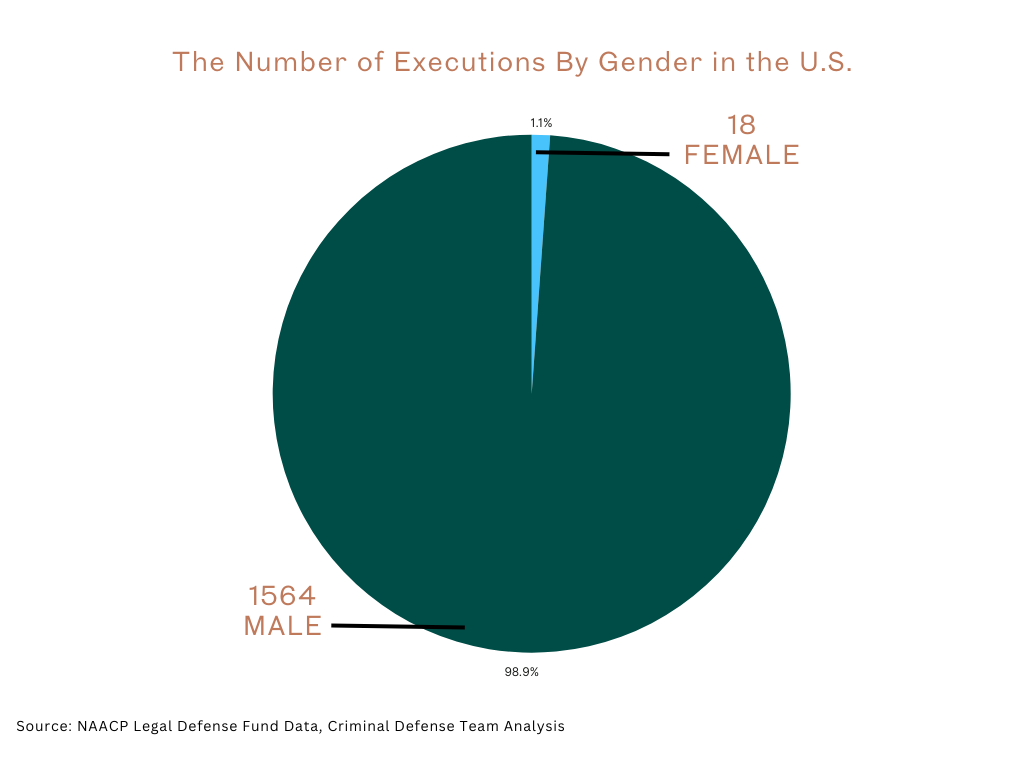
The disparity between male and female executions in the United States is notable. Out of the 1,602 individuals executed since the death penalty was reinstated, 1,584 were men, while only 18 were women. This stark difference reflects the broader trends in the criminal justice system, where women constitute a very small percentage of those sentenced to death and subsequently executed.
Ethnicities of People Executed on Death Row
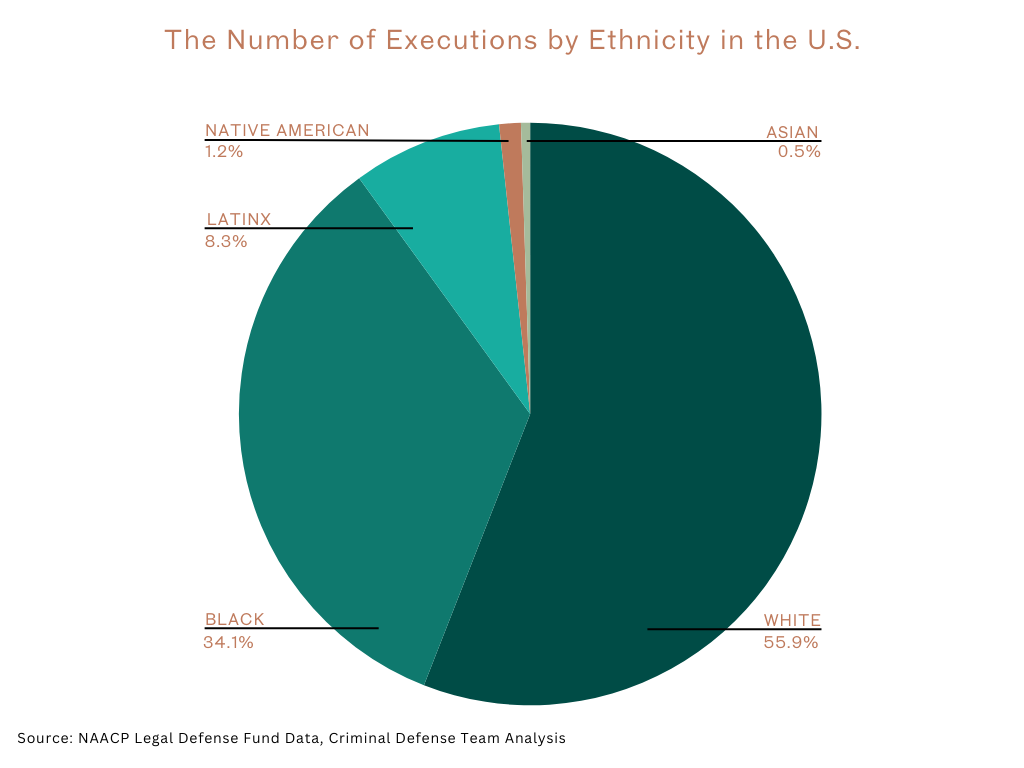
The ethnic breakdown of individuals executed on death row in the United States shows a clear predominance of White individuals, who account for 885 of the 1,581 executions. Black individuals are the second-largest group, with 539 executions, followed by Latinx individuals with 131. Native Americans and Asians represent smaller proportions, with 19 and 8 executions, respectively. This distribution highlights the varying representation of different ethnic groups among those executed, reflecting differences in the application of capital punishment across racial and ethnic lines.
Wrongful Convictions of Death Row
Wrongful convictions are a significant issue in the United States, especially for individuals on death row. Studies have shown that a disturbing number of death row inmates have been wrongfully convicted, often due to flawed legal procedures, false testimonies, and prosecutorial misconduct. Since 1973, over 190 death row inmates have been exonerated, with many spending years, even decades, awaiting execution for crimes they did not commit.
The justice system’s imperfections, including inadequate defense representation and racial bias, contribute to these miscarriages of justice. DNA evidence and advancements in forensic technology have played a crucial role in uncovering wrongful convictions. However, the irreversible nature of capital punishment raises questions about the morality of the death penalty, especially when innocent lives are at risk.
Law firms specializing in criminal defense are essential in uncovering wrongful convictions. They fight to ensure that justice is served, highlighting the need for ongoing reforms to prevent such injustices in the future.
On September 24, 2024, Marcellus Williams was executed in the state of Missouri with the use of a lethal injection. Throughout his sentence in prison, he continued to maintain his innocence, which was backed by his attorney and even one of his prosecutors. It was stated that no DNA was ever connected to Williams in the crime scene and his prosecutor claimed that the execution “should have been called off.” The victim’s family also claimed that they “define closure as Marcellus being allowed to live.”
Death Row Final Meals
The tradition of offering a final meal to inmates on death row is a unique and long-standing practice in the United States. This ritual, observed across various states, allows prisoners to request a meal of their choice before their execution. The concept of a final meal has garnered public attention over the years, often highlighting the personal preferences of those facing their last moments.
While some people often go all out and request huge meals and some request smaller meals, other people have also made some other interesting or specific requests.
Interesting Final Meals
Matthew Reeves
Date of Execution: January 27, 2022
Charges: Capital Murder
Final Meal: Reeves originally declined his final meal but later asked for just a bottle of Sprite.
Odell Barnes Jr.
Date of Execution: March 1, 2000
Charges: Capital Murder
Final Meal: Barnes also declined his final meal but had a special “final meal” request of “Justice, Equality, World Peace.”
James Edward Smith
Date of Execution: June 26, 1990
Charges: Capital Murder
Final Meal: Smith requested “Rhaeakunda dirt” as his final meal. It is not completely understood why but it is believed that it is a type of dirt used in voodoo, where the dirt is eaten.
Thomas J. Grasso
Date of Execution: March 20, 1995
Charges: First-Degree Murder
Final Meal: Grasso requested a huge meal consisting of a double cheeseburger from Burger King, a half-dozen barbecue ribs, two dozen steamed mussels, two dozen steamed clams, half a pumpkin pie with whipped cream, diced strawberries, two strawberry milkshakes, and a 16-ounce can of SpagehttiO’s. Before his execution, he gave a final statement complaining that he did not get his SpaghettiO’s but got spaghetti and wanted the press to know about it.
Ledell Lee
Date of Execution: April 20, 2017
Charges: Capital Murder and Rape
Final Meal: Lee requested Holy Communion as his final meal.
Gary Carl Simmons Jr.
Date of Execution: April
Charges: Capital Murder, Kidnapping, Rape
Final Meal: Simmons requested a feast of almost 29,000 calories. This feast included one medium Super Supreme Deep Dish pizza from Pizza Hut with double portions, including mushrooms, onions, jalapeno peppers, pepperoni and another pizza with regular portions of three cheeses, olives, bell peppers, tomatoes, garlic and Italian sausage. Other foods in the feast are a family-size bag of nacho cheese Doritos, jalapeno nacho cheese, sliced jalapenos, 2 large strawberry shakes, a super-size order of McDonald’s french fries, two 20-oz of cherry Coke, and two pints of strawberry ice cream.
Peter J. Miniel
Date of Execution: October 6, 2004
Charges: Capital Murder
Final Meal: Miniel’s final meal consisted of 20 beef tacos, 20 beef enchiladas, a pizza with jalapenos, fried chicken, spaghetti with salt, half a chocolate cake, half a vanilla cake, cookies and cream ice cream, caramel pecan fudge ice cream, a fruit cake, two Cokes, two Pepsi’s, two root beers, and two orange juices.
Methodology
The data presented in this report was sourced from the Legal Defense Fund (LDF) and its Death Row USA Winter 2024 quarterly report. It covers the period from the reinstatement of the death penalty in 1976 through January 1, 2024, and reflects all recorded executions in the United States during this timeframe.
This report specifically excludes any executions that occurred prior to 1976, focusing solely on the modern era of capital punishment. By doing so, the data provides a comprehensive view of how the death penalty has been applied in the U.S. since its reinstatement.
2024 Death Row Executions
Throughout 2024, there have been 25 prisoners who have been executed in the United States bringing the total number of people executed to 1,607 people. The prisoners who have been executed in 2024 are:
Kenneth Eugene Smith – A 58 year old man executed on January 25, 2024, in Alabama.
Ivan Cantu – A 50 year old man executed on February 28, 2024, in Texas.
Willie James Pye – A 59 year old man executed on March 30, 2024, in Georgia.
Michael Dewayne Smith – A 41 year old man executed on April 4, 2024, in Oklahoma.
Brian Dorsey – A 52 year old man executed on April 9, 2024, in Missouri.
Jamie Ray Mills – A 50 year old man executed on May 30, 2024, in Alabama.
David R. Hosier – A 69 year old man executed on June 11, 2024, in Missouri.
Ramiro Felix Gonzales – A 41 year old man executed on June 26, 2024, in Texas.
Richard Norman Rojem Jr. – A 66 year old man executed on June 27, 2024, in Oklahoma.
Keith Edmund Gavin – A 64 year old man executed on July 18, 2024, in Alabama.
Arthur Lee Burton – A 54 year old man executed on August 7, 2024, in Texas.
Taberon Dave Honie – A 48 year old man executed on August 8, 2024, in Utah.
Loran Kentsley Cole – A 57 year old man executed on August 29, 2024, in Florida.
Freddie “Khalil” Owens – A 46 year old man executed on September 20, 2024, in South Carolina.
Marcellus “Khalifa” Williams – A 55 year old man executed on September 24, 2024, in Missouri.
Travis James Mullis – A 38 year old man executed on September 24, 2024, in Texas.
Emmanuel Antonio Littlejohn – A 52 year old man executed on September 26, 2024, in Oklahoma.
Alan Eugene Miller – A 59 year old man executed on September 26, 2024, in Alabama.
Garcia Glen White – A 61 year old man executed on October 1, 2024, in Texas.
Derrick Ryan Dearman – A 36 year old man executed on October 17, 2024, in Alabama.
Richard Bernard Moore – A 59 year old man executed on November 1, 2024, in South Carolina.
Carey Dale Grayson – A 50 year old man executed on November 21, 2024, in Alabama.
Christopher Leroy Collings – A 49 year old man executed on December 3, 2024, in Missouri.
Joseph Edward Corcoran – A 49 year old man executed on December 18, 2024, in Indiana.
Kevin Ray Underwood – A 45 year old man executed on December 19, 2024, in Oklahoma.
Death Row Executions in 2025
There has been a total of 29 executions across 10 states in 2025 with the most recent being on August 19, 2025, which brings the total executions in the US to 1,636. These 10 states include:
Arizona: 1 execution
Indiana: 1 execution
Louisiana: 1 execution
Mississippi: 1 execution
Oklahoma: 2 executions
Tennessee: 2 executions
Alabama: 3 executions
South Carolina: 4 executions
Texas: 4 executions
Florida: 10 executions
In August 19, 2025, Kayle Barrington Bates was executed in Florida. On the day of his execution, Bates refused a final meal as well as refusing to speak any last words. Bates was administered a lethal injection at 6:01 PM and was pronounced dead by 6:17 PM.
Upcoming Executions
There is a total of 11 more executions scheduled for the rest of 2025 with the next one coming up in August 28, 2025, with Curtis Windom in Florida.